But solar is a capital decision, not an impulse buy. Before committing, decision-makers need to understand one number above all others: ROI. This guide breaks down the formula, the inputs that actually determine accuracy, the California-specific factors that strengthen returns, and the mistakes that erode them.
Key Takeaways
- Commercial solar payback periods run 4.2 to 6.3 years for modeled commercial systems, per Wood Mackenzie modeling
- ROI measures net financial gain against total post-incentive system cost—expressed as a percentage of that investment
- The 30% federal ITC, 5-year MACRS, and 100% first-year bonus depreciation significantly reduce effective system cost
- California's commercial electricity rates are roughly 2x the national average, making avoided-cost savings structurally stronger than most U.S. markets
- System design quality, self-consumption optimization, and active monitoring determine whether projected ROI becomes actual ROI
What Is Commercial Solar ROI?
ROI measures what you get back relative to what you put in. For commercial solar, the formula is straightforward: net financial gain divided by total investment, expressed as a percentage. A system that costs $500,000 net and generates $600,000 in cumulative savings delivers a 20% ROI — a $100,000 net gain on the original investment.
What makes solar ROI unusually predictable compared to most capital expenditures is that the two primary inputs — sunlight and electricity rates — don't swing with market sentiment or competitive dynamics. Output is consistent year over year.
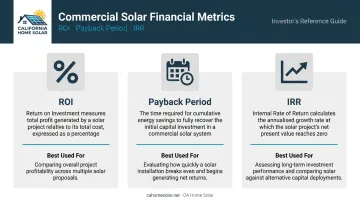
Three Metrics Worth Distinguishing
Business owners regularly encounter three related but different financial measures:
- ROI — Total profitability over the system's lifetime as a percentage. Best for comparing solar against other capital investments
- Payback Period — The point at which cumulative savings equal total investment. More intuitive for cash flow planning
- IRR (Internal Rate of Return) — The discount rate at which the project's net present value equals zero. Most useful when comparing projects of different sizes or timelines — for example, a $200K rooftop system versus a $1M ground-mount — because it factors in when savings actually arrive, not just the total amount
For most commercial solar decisions, payback period drives initial intuition, while IRR and ROI inform board-level capital allocation discussions. Understanding what shapes each number — system size, local utility rates, available incentives — is the next step.
How to Calculate Commercial Solar ROI
The formula is straightforward — what separates a useful projection from a misleading one is the accuracy of the inputs you plug in.
Core formula: (Total Financial Gain − Total Investment Cost) ÷ Total Investment Cost × 100 = ROI%
Building the Cost Side
Total Investment Cost includes:
- Equipment (panels, inverters, racking)
- Engineering and system design
- Labor and installation
- Permitting and interconnection fees
- Any required structural building upgrades
According to NREL's 2024 Annual Technology Baseline, commercial PV installed cost benchmarked at $1.78 per watt DC in 2023. A 250 kW system would therefore run approximately $445,000 gross before incentives.
Two cost figures matter in different conversations: gross cost (what you pay before incentives) and net cost (what you effectively pay after the ITC and depreciation benefits are applied). For ROI calculations, net cost is the relevant denominator.
Building the Gain Side
Total Financial Gain includes:
- Avoided electricity purchases (kWh produced × your utility rate)
- Net metering or net billing credits for exported energy
- Potential increase in property value at sale
One important note for California: unlike some other states, California does not operate a traditional SREC (Solar Renewable Energy Certificate) market, so SREC income should not be factored into California commercial ROI models.
Using your building's actual 12-month consumption profile produces more accurate projections than industry averages — it prevents both undersizing a system that leaves savings on the table and oversizing one that inflates upfront costs. California Home Solar's commercial assessment starts with real utility data from your facility, not generic benchmarks.
Sample Calculation (Illustrative)
The following figures are illustrative, using rounded inputs consistent with current California market context. They are not guaranteed outcomes.
| Input | Illustrative Value |
|---|---|
| System size | 250 kW DC |
| Gross installed cost ($1.78/W) | ~$445,000 |
| Federal ITC (30%) | −$133,500 |
| Net cost after ITC | ~$311,500 |
| Annual electricity savings (at $0.28/kWh) | ~$75,000 |
| Annual O&M costs (~$19/kW/yr) | −$4,750 |
| Net annual benefit | ~$70,250 |
| Simple payback (net cost ÷ net annual benefit) | ~4.4 years |
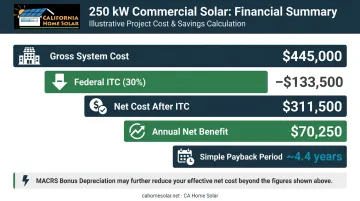
Add MACRS bonus depreciation (covered in the next section), and the effective net cost drops further — in many cases shaving one to two years off that payback estimate.
Don't Forget Operating Costs
Fixed O&M for commercial PV runs approximately $19 per kW DC per year per NREL benchmarks. For a 250 kW system, that's roughly $4,750 annually covering monitoring, inspections, and inverter maintenance. Subtract this from gross annual savings to arrive at honest net annual benefit.
Key Factors That Affect Your Commercial Solar ROI
Electricity Rates and Usage Volume
The higher your electricity rate, the more each kilowatt-hour of solar generation is worth. California commercial customers pay an average of 28.18 cents per kWh—versus the U.S. commercial average of 13.92 cents—meaning the same solar system generates roughly twice the dollar savings in California compared to the national average. California commercial rates have also trended sharply upward in recent years, compounding long-term savings projections.
Load profile matters too. A business operating primarily during daylight hours—retail, manufacturing, food service—captures more direct value from solar generation. Heavy nighttime energy users get less immediate benefit without paired battery storage.
Incentives and Tax Treatment
Three federal mechanisms meaningfully improve commercial solar ROI:
1. Investment Tax Credit (ITC) Commercial systems currently qualify for a 30% ITC on eligible installations. Projects over 1 MW must meet prevailing wage and apprenticeship (PWA) requirements to access the full 30%; systems failing those requirements fall to a 6% base credit. Phase-down is currently described as no earlier than the 2030s, but verify current begin-construction requirements with your tax advisor before filing.
2. MACRS Depreciation Commercial solar qualifies for 5-year MACRS cost recovery. If the 30% ITC is claimed, the depreciable basis is reduced by half the credit amount, leaving 85% of the system cost eligible for depreciation.
3. Bonus Depreciation IRS guidance issued January 2026 confirms 100% first-year bonus depreciation for qualified property acquired after January 19, 2025. This significantly front-loads tax benefits, improving early-year ROI for businesses with strong taxable income.
Tax position matters. A business with strong taxable income captures these benefits fully in year one. Consult a CPA before finalizing ROI projections.
Financing Structure
| Structure | Key Benefit | Key Tradeoff |
|---|---|---|
| Cash purchase | Maximum lifetime ROI; immediate tax benefit access | Largest upfront capital outlay |
| Loan financing | Preserves capital; positive cash flow if savings exceed debt service | Interest cost reduces lifetime ROI |
| Lease / PPA | Lowest upfront cost | Business typically does not capture ITC or depreciation directly |
The right structure depends on the company's tax position and capital priorities. There's no single correct answer.
System Design and Panel Efficiency
System size should match actual consumption, not exceed it. Oversizing doesn't proportionally improve ROI and can create grid interconnection complications.
For properties with limited roof space, higher-efficiency panels produce more power per square foot—worth the premium in constrained situations. Commercial properties with open land can also consider ground-mount systems, which allow optimal panel angle and easier maintenance access than rooftop installations. CA Home Solar installs both rooftop and ground-mount systems for commercial clients throughout Southern California.
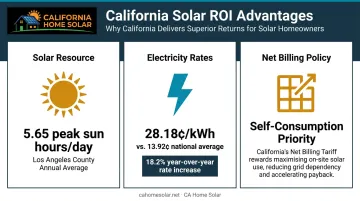
Why California Businesses Get Stronger Solar ROI
Southern California businesses benefit from three structural conditions that most of the country simply doesn't have — and each one directly improves solar ROI.
1. Solar resource. Los Angeles County averages 5.65 peak sun hours per day annually, based on NASA POWER climatology data for the LA area (ranging from 2.86 in December to 8.10 in June). More peak sun hours mean more energy generated per watt of installed capacity.
2. Electricity rates. Already covered: California commercial rates are more than double the national average, and they're rising faster—18.2% year-over-year versus 5.8% nationally.
3. Net Billing policy. California's Net Billing Tariff (NBT), established by CPUC Decision D.22-12-056 and applicable to interconnection applications filed on or after April 15, 2023, credits exported solar energy based on its avoided cost to the grid rather than the prior retail rate. This makes self-consumption—using solar power directly on-site—more valuable than exporting excess generation.
What NBT Means for Commercial System Design
Under the current net billing structure, the design priority shifts. Systems should be sized to match daytime on-site load rather than to maximize export. Nearly 70% of NBT customers had paired batteries with solar by end of 2024, according to CPUC data—and for good reason. Battery storage allows businesses to capture excess midday generation and shift it to evening peak-rate periods, avoiding the highest-cost hours on the utility bill.
According to NREL research, demand charges can exceed 50% of a commercial customer's monthly bill—making storage an increasingly important tool for commercial ROI optimization in California.
California's Self-Generation Incentive Program (SGIP) can offset storage costs directly — non-residential equity storage rebates were set at $850/kWh per recent CPUC data, though availability should be confirmed before finalizing a project budget.
California Incentives Beyond the Federal ITC
Stacking these programs on top of the federal ITC is where California businesses can meaningfully compress payback timelines. Current commercial programs worth investigating include:
- SGIP battery storage rebates through SCE and LADWP
- LADWP commercial solar programs including Virtual Net Metering
- Commercial PACE financing (the HERO program is listed as inactive for new applications; check the California State Treasurer's current enrolled PACE program list for active alternatives)
- Local utility and municipal green business programs in specific LA-area jurisdictions
CA Home Solar has navigated SCE, LADWP, and other Southern California utility interconnections for 36 years — including through multiple NEM and NBT policy transitions. That hands-on history with local processes (and recognition as a Top 500 Solar Contractor in both 2023 and 2025) translates directly into fewer delays and more accurate incentive projections for commercial clients.
How to Maximize Your Commercial Solar ROI
Strategies That Improve Financial Returns
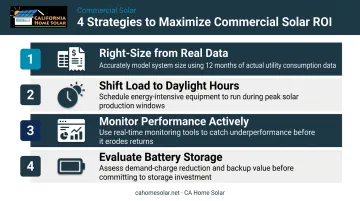
- Right-size from real data: Pull 12 months of utility bills before sizing. Systems built around actual consumption produce far more accurate projections than square footage rules of thumb.
- Shift load to daylight hours: Under NEM Billing Tariff (NBT), on-site solar consumption is worth more than export. Scheduling HVAC cycling, equipment startups, and high-draw processes during peak solar hours increases direct self-consumption.
- Monitor performance actively: Digital monitoring catches underperformance before it compounds. In the LA Basin, dust accumulation is a real production drag — CA Home Solar recommends at least twice-yearly panel cleaning, with higher frequency depending on local dust and pollen conditions.
- Evaluate battery storage: California's time-of-use rates and the shift away from retail-rate export credits make battery storage increasingly worthwhile — especially when SGIP incentives offset a portion of storage costs.
Common Mistakes That Reduce ROI
- Using gross cost as your investment figure overstates payback period and understates ROI. Net cost after ITC and depreciation is the number that matters
- Assuming flat electricity rates: California commercial rates rose 18.2% in a single year. Even a conservative 3–5% annual escalation assumption changes the long-term ROI picture significantly
- Choosing installers on price alone: If a contractor closes after installation, warranty claims get complicated fast. Vet longevity, financial stability, and manufacturer warranty support alongside the bid
Frequently Asked Questions
What is the average return on commercial solar installations?
Wood Mackenzie modeled payback periods of 4.2 to 6.3 years for standard commercial systems, with returns varying by system size, location, and incentive access. California businesses tend to land toward the stronger end of that range, driven by high electricity rates and strong sun exposure.
How long does it take for commercial solar to pay for itself?
Current Wood Mackenzie modeling puts commercial payback at 4.2 to 6.3 years depending on electricity rate escalation assumptions. California's above-average rates and available tax incentives tend to push payback toward the shorter end of that range.
What incentives are available for commercial solar in California?
The federal 30% ITC, 5-year MACRS, and 100% first-year bonus depreciation (for property acquired after January 19, 2025) are the primary drivers. California-specific programs include SGIP battery storage rebates and LADWP commercial solar programs. Verify current program availability and budget status before finalizing financial projections.
How does financing affect commercial solar ROI?
Cash purchases deliver the highest lifetime ROI and immediate access to ITC and depreciation benefits. Loans can still produce positive cash flow when annual savings exceed debt service. Leases and PPAs lower upfront costs but typically transfer tax benefits to the financing party, reducing the business's direct financial return.
Does commercial solar increase property value?
Commercial properties with solar installations generally command higher valuations, though no reliable average percentage premium exists for commercial properties. Factor it as a qualitative benefit and get a formal appraisal if precise valuation impact matters for your decision.
What risks could reduce the ROI of my commercial solar system?
Key risks include further changes to net metering/billing policy, unexpected electricity rate drops, equipment underperformance without active monitoring, and installer insolvency affecting warranty access. Active monitoring and choosing a financially stable, long-tenured installer mitigate most of these risks.