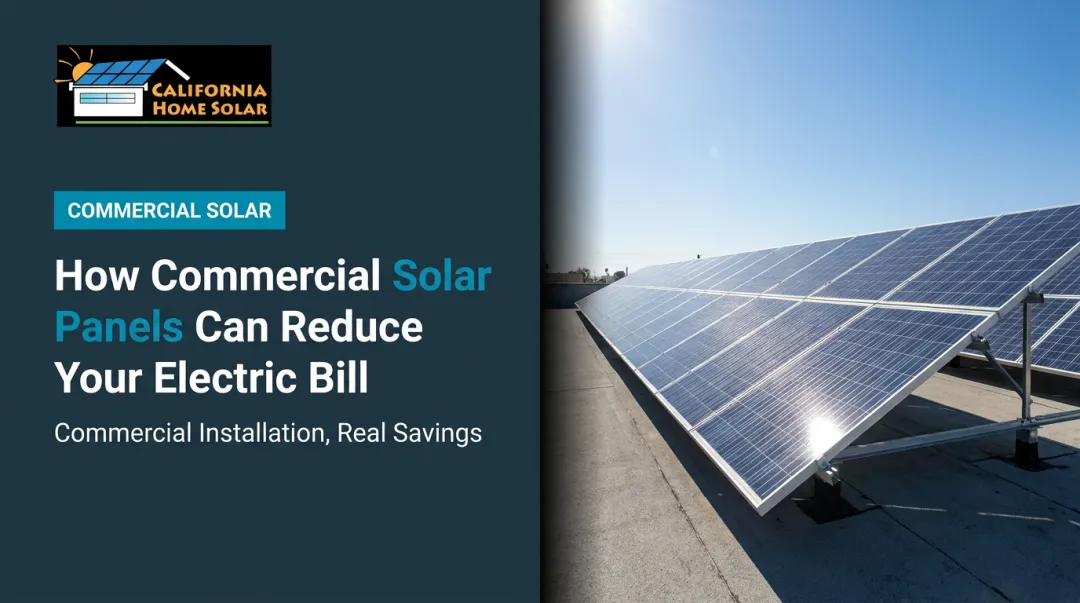
Commercial solar can deliver real, measurable savings — but the number on your proposal depends heavily on your facility, energy consumption, and how you structure the financing. This article breaks down realistic savings ranges by business size, the factors that drive those numbers up or down, and what it takes to estimate your own ROI.
Key Takeaways
- California commercial electricity costs more than twice the national average, making solar ROI faster here than almost anywhere else in the U.S.
- Typical commercial solar systems offset 40%–80%+ of electricity costs, depending on system size and load profile.
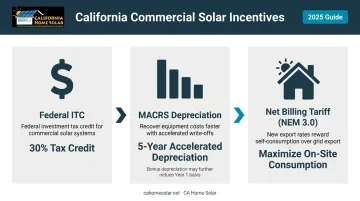
- The 30% federal Investment Tax Credit (ITC) and MACRS accelerated depreciation can cut your net system cost by 30% or more in year one.
- Demand charges — which can represent 30%–70% of commercial utility bills — are a major savings lever for larger facilities.
- Under NEM 3.0 (Net Billing Tariff), self-consumption is where the savings are — exporting surplus power to the grid now returns far less than using it on-site.
How Much Can Commercial Solar Save Your Business?
Savings aren't one-size-fits-all. A small restaurant and a 50,000-square-foot warehouse will see very different outcomes — even if both are in the same zip code. Two mistakes trip up business owners early in this process: focusing only on upfront cost, or applying national average savings figures to a California-specific situation.
Here's a realistic breakdown by facility size.
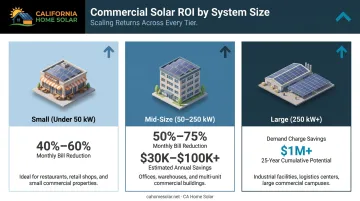
Small Commercial Operations (Under 50 kW)
Small retail shops, offices, and restaurants typically install systems in the 20–50 kW range. At current California commercial rates, this tier can realistically reduce monthly electricity costs by 40%–60%, depending on how well daytime generation aligns with operational load.
A restaurant open for lunch and dinner service, for example, runs kitchen equipment, refrigeration, and HVAC during peak solar production hours — making it a strong candidate for significant bill reduction without battery storage.
What's typically included at this scale:
- Sizes the rooftop panel array to available roof space
- Installs string or micro-inverters based on shading conditions
- Sets up basic system monitoring for production tracking
- Manages permitting and utility interconnection
Battery storage and advanced demand management are generally add-ons at this tier, not standard. Businesses with predictable daytime energy use and unobstructed roof access benefit most.
Mid-Size Businesses and Office Buildings (50–250 kW)
This tier often delivers the strongest ROI relative to investment. Mid-size operations have enough energy consumption to justify commercial-grade equipment and enough roof space to deploy a system that meaningfully offsets the bill.
Expected outcomes:
- 50%–75% reduction in electricity costs
- Annual savings in the range of $30,000–$100,000+, depending on consumption and utility rate structure
- Payback periods that compress quickly when ITC and MACRS are applied
Typical inclusions at this scale: commercial-grade panels, inverters with optimizer compatibility (SolarEdge or Enphase IQ8 series are common), net metering or Net Billing Tariff enrollment, and full permitting management. CA Home Solar manages every stage — site survey and design, permitting, installation, and permission to operate — so nothing falls through the cracks.
Large Commercial and Industrial Facilities (250 kW+)
At this scale, energy charges are only part of the picture. Large facilities also face demand charges, which according to USDA Forest Service guidance can represent 30%–70% of a commercial customer's total electric bill. Solar generation during peak afternoon hours reduces those demand spikes — in some cases, the demand charge savings outpace the energy charge savings entirely.
This is where system design matters most. A well-engineered system timed to your facility's peak load schedule will cut both line items simultaneously.
CA Home Solar has designed and installed systems at this scale, including a 240 kW commercial installation in Pacoima, CA.
Over a 25-year system lifespan, large facilities can realize cumulative savings reaching hundreds of thousands to over a million dollars, depending on system size, tariff structure, and rate escalation. Custom engineering, industrial-grade inverters, and 24/7 monitoring are standard at this tier.
Key Factors That Determine Your Commercial Solar Savings
Savings potential is shaped by a mix of technical, financial, and site-specific variables. Understanding these helps set realistic expectations before you get a proposal.
System Size Relative to Your Energy Consumption
A properly sized system — matched to your actual energy load — is the single biggest determinant of savings. Oversizing wastes capital on generation you can't use or export at poor rates. Undersizing leaves bill reduction on the table.
CA Home Solar conducts a facility assessment during the initial consultation, analyzing energy consumption patterns to design a system that maximizes generation relative to your specific load profile and available space.
Local Electricity Rates
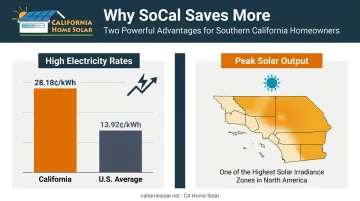
This is where California businesses have a structural advantage. At 28.18 cents/kWh (March 2026, EIA), every kWh your system produces delivers savings at more than twice the rate it would in the average U.S. state. That multiplier compounds over a 25-year system life.
Rate escalation adds another dimension: U.S. commercial rates climbed from 12.75 cents/kWh in 2024 to 13.41 cents/kWh in 2025 and 13.92 cents/kWh by March 2026. California's rate trend has followed a similar upward trajectory, which means the savings gap between solar and grid power widens every year you own the system.
Available Incentives and Tax Benefits
Three incentives do the heaviest lifting on commercial solar economics:
- Federal Investment Tax Credit (ITC): A 30% reduction on eligible installation costs for systems beginning construction in 2023 or later. This is a dollar-for-dollar credit against federal tax liability.
- MACRS Accelerated Depreciation: Allows businesses to depreciate the solar asset over 5 years, reducing taxable income. The actual value depends on your tax rate and appetite — consult a tax advisor for project-specific modeling.
- California Net Billing Tariff (NEM 3.0): For systems interconnected after April 15, 2023, export compensation is based on avoided-cost values rather than full retail rates. This shifts the savings strategy toward maximizing on-site consumption rather than exporting midday generation.
Combined, these incentives can significantly shorten payback periods — and your roof and operating schedule determine how much of that potential you actually capture.
Roof Conditions and Operational Hours
Roof age, orientation, tilt, and shading all affect system output. South-facing, unobstructed roofs in Southern California produce near-maximum annual yield, with the region's year-round sunshine meaning fewer weather-related production losses than most U.S. markets.
Your operating schedule matters just as much as your roof. Businesses that run primarily during daylight hours capture the most value because solar generation and consumption align naturally:
- Retail and warehouse operations typically see the strongest offset rates
- Manufacturing facilities with daytime shifts match solar output closely to peak demand
- Heavy nighttime loads reduce the offset percentage unless battery storage is added to capture and dispatch daytime generation
Beyond the Electric Bill: The Full Financial Picture
The electricity cost reduction is the headline number, but it's not the whole story.
Demand Charge Reduction
For mid-size and large commercial accounts, demand charges — billed based on your peak power draw during a billing period — can represent 30–50% of a California utility bill. Solar generation during peak afternoon hours flattens those demand spikes directly.
The savings are tariff-specific and depend on your load shape, but facilities with afternoon peaks that align with solar production often see meaningful demand charge reductions on top of their energy cost savings.
Protection Against Rising Energy Rates
Installing solar locks in a predictable energy cost. Grid rates keep climbing, but your solar generation cost is fixed at installation. That hedge grows more valuable every year rates increase.
Increased Property Value
Commercial properties with owned solar systems generally show up differently in appraisals and lease negotiations. Buyers and tenants recognize lower operating costs as a tangible financial asset. The DOE's Better Buildings program documents commercial PV as a factor in asset value discussions, though the actual uplift varies by property rather than following a universal percentage.
ESG and Business Reputation
Installed solar provides concrete, measurable environmental data — not just a stated commitment. That matters to:
- Customers who factor sustainability into purchasing decisions
- Enterprise clients that require ESG disclosures from vendors
- Investment partners evaluating environmental risk profiles
- Internal reporting against carbon reduction targets
For businesses pursuing large contracts or benchmarking against ESG frameworks, solar gives you numbers to report, not talking points.
Why Southern California Businesses Save Even More
Southern California combines two savings drivers that rarely align this strongly: some of the highest commercial electricity rates in the nation and exceptional year-round solar output.
The rate premium is real. At 28.18 cents/kWh, California commercial customers pay more than twice the U.S. average. Every solar kWh produced here is worth more in bill reduction than in lower-rate markets — and those savings compound over the system's life.
Solar output reinforces that advantage. Southern California's climate delivers consistent irradiance with minimal weather disruption, so systems here operate near peak output year-round — higher annual production and faster payback than systems in cloudier or more variable climates.
California-Specific Programs Worth Knowing
- Net Billing Tariff (NEM 3.0): Effective for applications submitted after April 15, 2023. Export compensation is based on avoided-cost rates rather than retail. Size your system for on-site consumption, and consider storage to capture surplus generation for evening or peak-demand use.
- SGIP (Self-Generation Incentive Program): CPUC's storage incentive program offers rebates for commercial battery storage paired with solar. Non-Residential Equity and Large-Scale Storage categories have been available, though incentive steps and budgets change — verify current availability before factoring it into your project budget.
- SCE and LADWP Programs: Both utilities maintain solar and storage program pages for business customers. SCE's Solar for Business is a starting point for Edison-served accounts. LADWP's Virtual Net Metering program is relevant for multifamily and commercial property owners within LADWP territory.
Owning vs. Leasing: How Financing Affects Total Savings
The financing structure you choose determines how much of the financial upside you actually keep.
| Factor | Ownership (Cash or Loan) | Lease / PPA |
|---|---|---|
| Federal ITC (30%) | You keep it | Goes to third-party owner |
| MACRS depreciation | You claim it | Goes to third-party owner |
| Monthly payments | Loan payment (temporary) | Lease payment (ongoing) |
| Long-term savings | Higher — own the energy | Capped — paying for usage |
| Upfront barrier | Higher (mitigated by loans) | Lower |
For most tax-paying businesses with access to financing, ownership delivers a stronger total return. The ITC and MACRS benefits alone can cover a large share of system cost — and those benefits go to the financing company under a lease, not to your business.
California Home Solar is a HERO Registered Contractor and works with programs including HERO, California First, and Ygrene to help commercial clients own their systems outright. For eligible properties, these programs can reduce or eliminate the upfront barrier while preserving the full tax and depreciation benefits that make ownership the stronger long-term play.
How to Estimate Your Business's Solar Savings Potential
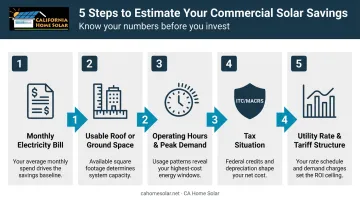
A rough estimate requires five inputs:
- Average monthly electricity bill — establishes baseline spend
- Usable roof or ground space — determines maximum system size
- Operating hours and peak demand windows — identifies generation-consumption alignment
- Tax situation — determines ITC and MACRS value
- Current utility rate and tariff structure — drives the per-kWh savings calculation
Even approximate values for these five inputs produce a meaningful savings range. The more precise your consumption data and tariff details, the tighter the projection.
For the most accurate picture, a professional site assessment covers roof conditions, shading, interval consumption data, and your specific utility tariff to produce a project-specific ROI model.
CA Home Solar offers free consultations that include a full facility assessment and financial analysis of expected system performance — no commitment required. With 36 years serving businesses across Los Angeles and Southern California, the team can show you exactly what solar could deliver for your operation. Call 877-903-1012 or email info@cahomesolar.com to get started.
Frequently Asked Questions
Are solar panels worth it for commercial buildings?
For most businesses with moderate-to-high electricity bills, yes. California's above-average rates and strong solar resource make the economics more favorable here than in most states. Incentives like the 30% ITC and MACRS depreciation accelerate the payback timeline considerably.
How long does it take for commercial solar to pay for itself?
Most Southern California commercial systems pay back in 4–7 years, depending on system size, energy consumption, and your utility tariff. After that point, you're generating electricity at effectively no cost for the remaining 20+ years of the system's life.
What percentage of my electricity bill can commercial solar eliminate?
Most commercial systems offset 60%–90% of electricity costs when properly sized to the facility's load. Some businesses with favorable conditions achieve near-zero utility bills. The exact offset depends on system size, daytime energy use, and whether battery storage is included.
What incentives are available for commercial solar in California?
The main incentives are the federal 30% Investment Tax Credit (ITC), MACRS accelerated depreciation, and California's Net Billing Tariff, which compensates you for excess power sent back to the grid. Commercial battery storage may also qualify for SGIP rebates. A tax advisor can model the combined impact for your specific project, but these incentives together often cut the effective system cost by 40%–50%.
Does commercial solar increase my property value?
Owned solar systems reduce operating expenses, which makes commercial properties more attractive to buyers and tenants. The DOE's Better Buildings program recognizes solar PV as a factor in commercial property appraisals, and lower utility costs translate directly into higher net operating income.
Should I buy or lease my commercial solar system?
Ownership delivers better long-term returns for most tax-paying businesses because you keep the ITC and MACRS depreciation benefits. Leases and PPAs reduce upfront costs but hand those tax advantages to the financing company, which lowers your total savings over time.