Industrial solar is widely discussed, but the conversation often drifts toward environmental messaging before addressing what business owners actually need to evaluate: operational impact, financial returns, and whether the numbers make sense for their facility.
This article focuses on the measurable business advantages of industrial solar energy systems — lower operating costs, accelerated ROI through tax incentives, and improved energy independence — with the specific context that matters for Southern California operations.
Key Takeaways
- Industrial solar generates electricity on-site, reducing how much businesses buy from the utility grid
- California commercial rates run roughly 2x the national average — each kilowatt-hour offset saves more here than in most other states
- The Investment Tax Credit and 5-year MACRS depreciation can cut the net cost of installation considerably
- Solar + battery storage reduces both demand charges and outage risk for energy-intensive operations
- Every month of delay means full exposure to utility rate increases — which haven't flattened
What Is an Industrial Solar Energy System?
An industrial solar energy system is a business-scale photovoltaic (PV) installation — typically ranging from 10 kW to several megawatts — designed to generate electricity on-site for manufacturing facilities, warehouses, distribution centers, food processing plants, and other commercial or industrial properties.
Where These Systems Are Installed
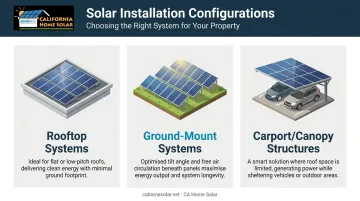
Three primary configurations cover most commercial applications:
- Rooftop systems — the most common for buildings with adequate flat or low-pitch roof space
- Ground-mount systems — used where land is available; ground-mount panels benefit from optimal tilt angles and natural air circulation, which improves efficiency
- Carport/canopy structures — attractive where roof space is limited or where covered parking is operationally useful
System size is determined by a facility's actual energy consumption profile, not a one-size-fits-all formula. The right configuration depends on evaluating current usage patterns, available roof or land area, and the financial goals of the business.
Solar as Infrastructure, Not Just a Green Initiative
Industrial solar is best understood as energy infrastructure. The decision logic mirrors upgrading production equipment or building systems — except solar generates direct financial returns, not just incremental cost reductions. A correctly sized, well-monitored system produces electricity for 25–30 years, and every kilowatt-hour generated offsets utility costs that would otherwise keep rising.
That's why CA Home Solar starts every commercial engagement with a facility assessment — evaluating current usage, site characteristics, and financial goals before any system is designed.
Key Advantages of Industrial Solar Energy Systems
The three advantages below are grounded in operational and financial outcomes — the kind of metrics facility managers and CFOs actually track.
Advantage 1: Significant Reduction in Electricity Costs
On-site solar generation directly offsets how much electricity a business buys from the utility. For most commercial facilities, this means lower consumption charges. For facilities on demand-rate tariffs, it can also reduce demand charges — the portion of commercial electric bills tied to peak usage, which NREL estimates accounts for roughly 25% of commercial-sector utility revenue nationally.
Why this hits harder in Southern California:
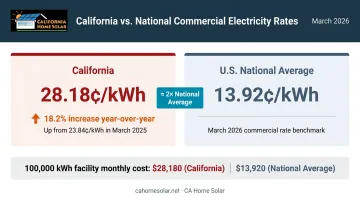
California's March 2026 commercial rate of 28.18 cents/kWh compares to a national average of 13.92 cents/kWh. For a facility consuming 100,000 kWh per month, that rate differential means each kilowatt-hour offset by solar is worth roughly twice as much as it would be in a typical U.S. market. At the March 2026 California rate, that same facility's monthly energy cost before demand charges and fixed fees would be approximately $28,180 — versus $13,920 at the national average. (These figures are illustrative calculations from EIA data, not tariff quotes.)
The rate lock advantage:
Once a system is installed, the electricity it generates is effectively "purchased" at a fixed, pre-determined cost — the levelized cost of the system over its useful life. California commercial rates rose from 23.84 cents/kWh in March 2025 to 28.18 cents/kWh in March 2026, an increase of approximately 18.2% in 12 months. Businesses with operating solar systems aren't exposed to that kind of swing on the portion of load their panels cover.
KPIs impacted:
- Monthly electricity expenditure
- Operating expense ratio
- Cost per unit of production (manufacturing)
- Gross margin
When this advantage is most pronounced: High daytime energy consumers — manufacturers running day shifts, cold storage operations, logistics facilities with active dock operations — see the largest bill reductions because solar output aligns with peak production hours.
Advantage 2: Accelerated ROI Through Tax Incentives and Depreciation
Federal tax policy can directly reduce what a business pays for a solar installation — through a credit against tax liability and accelerated depreciation. Two mechanisms are most relevant for commercial installations.
The Investment Tax Credit (ITC):
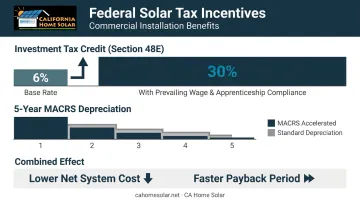
For systems placed in service after December 31, 2024, the IRS identifies the clean electricity investment credit under Section 48E as the applicable federal credit. The base rate is 6%, with the potential to reach 30% when prevailing wage and apprenticeship requirements are satisfied. Additional adders may apply based on domestic content and energy community eligibility. Because the actual credit value depends on compliance with labor requirements, tax posture, and placed-in-service timing, businesses should confirm their specific situation with tax counsel before projecting returns.
MACRS Accelerated Depreciation:
For qualified clean-energy facilities placed in service after December 31, 2024, businesses may be eligible for 5-year MACRS cost recovery. This front-loads significant tax deductions in the years immediately following installation, improving cash flow and reducing federal income tax liability faster than standard depreciation schedules allow.
Combined tax impact:
| Benefit | Effect |
|---|---|
| ITC (up to 30%) | Direct reduction in federal tax liability |
| 5-year MACRS | Accelerated deductions in years 1–5 |
| Combined | Lower effective system cost; faster payback |
California-specific programs:
The CPUC's Self-Generation Incentive Program (SGIP) provides financial incentives for qualifying technologies, most relevant to storage and resilience applications. The Net Billing Tariff governs compensation for exported generation under current interconnection applications. Specific rebates and tariff terms vary by utility service territory, so SCE customers should check SCE's business solar resources directly.
CA Home Solar's commercial assessments include a financial analysis that outlines expected performance and income-generating potential, and the team helps clients understand available incentive programs as part of the evaluation process.
KPIs impacted:
- Net installation cost after incentives
- Effective payback period
- Annual tax liability
- Operating cash flow over 10 and 20 years
Advantage 3: Energy Independence and Operational Resilience
Grid dependency is an operational risk — one that's easy to underweight until an outage disrupts production or damages temperature-sensitive inventory. In Southern California, CPUC's 2024 reliability data shows SCE customers experienced an average of 158.30 minutes of total annual outage time, including major event days. That's real exposure for facilities where uninterrupted power matters.
The financial cost of outages:
Berkeley Lab estimates U.S. power interruptions cost approximately $80 billion annually, with commercial customers bearing roughly $57 billion and industrial customers approximately $20 billion of that total. These figures are directional — actual per-facility exposure depends on operation type, load profile, and how long recovery takes — but they establish that outages have material financial consequences.
How solar + storage addresses this:
A grid-tied solar system alone does not provide backup power during outages. Pairing solar with battery storage shifts that exposure:
- Critical systems remain operational during grid interruptions
- Battery discharge during peak demand periods reduces demand charge exposure
- Energy supply becomes internally managed rather than grid-dependent
NREL research confirms that demand-charge savings from solar plus storage are greater under peak-period demand-charge tariff designs — the structure many Southern California commercial customers face.
The planning benefit:
Energy cost predictability matters beyond month-to-month savings. When a meaningful portion of a facility's electricity comes from an on-site system with known costs, multi-year financial forecasting becomes more reliable. That has real value for budgeting, capital planning, and investor or lender reporting.
KPIs impacted:
- Unplanned downtime incidents
- Demand charge line items on utility bills
- Energy cost variance month-over-month
- Operational continuity metrics
When this matters most: Mission-critical operations — food processing, cold chain logistics, manufacturing lines, data-intensive facilities — where downtime has a direct revenue or safety consequence.
What Happens When Businesses Delay Industrial Solar
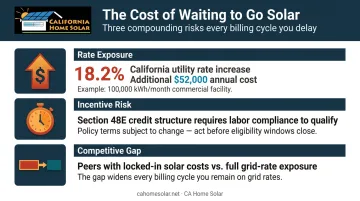
Delaying solar adoption isn't a neutral decision. Each month of inaction carries three distinct, compounding costs:
- Rate exposure: California's commercial electricity rate rose approximately 18.2% from March 2025 to March 2026. A facility consuming 100,000 kWh/month would have paid roughly $52,000 more per year at the March 2026 rate than the March 2025 rate, at unchanged consumption — a gap that existed whether or not the business was evaluating solar.
- Incentive risk: The federal credit structure shifted to Section 48E after December 31, 2024. Credit value now depends on labor compliance, placed-in-service timing, and policy rules that can change. Businesses evaluating solar in 2025 and 2026 are operating under a specific incentive window that isn't guaranteed to hold in future years.
- Competitive gap: Businesses that installed solar in prior years have already locked in a portion of their energy costs. Those still on full grid dependency are paying escalating market rates while their peers absorb the same consumption at stable, predetermined costs — and that gap widens every billing cycle.
How to Get the Most Value from an Industrial Solar System
Getting the financial outcomes described above requires more than just installing panels. Three operational factors determine how much value a system actually delivers.
- Right-size the system to your actual load. Undersized arrays leave savings on the table. Oversized systems generate excess energy that may not be compensated at a favorable rate under California's Net Billing Tariff. A proper energy assessment reviewing 12+ months of utility bills, load profiles, and facility characteristics is the starting point.
- Monitor performance actively. Modern commercial systems include tracking that flags underproduction, equipment issues, and efficiency losses. CA Home Solar provides 24/7 monitoring for commercial installations using Enphase IQ8 series inverters with integrated dashboards — but that data only creates value if someone reviews it and acts on alerts.
- Choose a licensed installer with commercial experience. California's permitting requirements, utility interconnection processes (SCE, LADWP, and municipal utilities each have different procedures), and available incentive programs add complexity to commercial solar projects.
CA Home Solar has been installing commercial and industrial solar systems across Los Angeles and Southern California for 36 years, holds Top 500 Solar Contractor recognition, and is a licensed, bonded HERO Registered Contractor. The company's commercial process covers assessment, permitting, installation, meter coordination, and system activation, with financing options including the HERO program.
Frequently Asked Questions
What are the industrial uses of solar energy?
Industrial solar powers manufacturing equipment, lighting, HVAC, refrigeration, and data systems across facility types including factories, warehouses, distribution centers, food processing plants, and logistics hubs. Any energy-intensive operation that runs during daylight hours is a practical candidate.
How much can a business save with an industrial solar energy system?
Savings depend on system size, facility energy consumption, utility rate structure, and incentive eligibility. California businesses tend to see above-average savings because commercial rates here are roughly twice the national average — meaning each kilowatt-hour offset by solar is worth significantly more than in most other states.
What tax incentives are available for industrial solar installations?
The primary federal incentive is the clean electricity investment credit (Section 48E), with a base rate of 6% and up to 30% with prevailing wage and apprenticeship compliance. 5-year MACRS depreciation is also available for qualifying systems. California adds SGIP (primarily for storage) and Net Billing Tariff credits for exported generation, with terms varying by utility territory.
How long does it take for an industrial solar system to pay for itself?
Payback timelines typically range from 4 to 8 years for commercial installations, depending on system cost, incentive eligibility, and financing structure. Facilities with higher energy loads and longer operating hours during daylight generally reach payback faster.
Can an industrial solar system keep a facility running during a power outage?
Grid-tied solar alone does not provide backup power during outages — the system shuts down when the grid goes down. Adding battery storage allows critical systems to remain operational during interruptions, making solar-plus-storage the right configuration for facilities where uptime is non-negotiable.
Is industrial solar worth it for businesses in California?
California's above-average commercial electricity rates, strong solar irradiance, and access to federal and state incentives make it one of the more financially compelling markets for industrial solar in the U.S. For Southern California businesses specifically, the combination of consistent sun exposure and high utility rates creates strong conditions for a favorable return on investment.